Data Science Manager · PayPal

I turn marketing data into decisions leadership acts on.

Data science leader in growth & marketing with 10 years in fintech — 8 at PayPal, plus consulting for American Express — specializing in experimentation, attribution, incrementality, and AI-powered analytics tools you can try live.

Analytics that gets acted on

Diagnose where growth is leaking, build the measurement to quantify it, and translate the numbers into decisions.

I lead growth and marketing analytics at PayPal — targeting and audience selection, behavioral segmentation, propensity scoring, attribution modeling, and experimentation standards across A/B tests, holdouts, and incrementality measurement. I've supported campaigns across email, onsite banners and placements, direct mail, digital (paid search and social), and sales channels, along with the data partnerships and vendors behind them, working cross-functionally with Marketing, Product, Commercial, Risk, and Finance.

Before PayPal, I built data engineering and reporting solutions for American Express as a consultant — the start of 10 years working with financial-services data. Increasingly, I build AI-enabled analytics tools with Claude: deterministic math does the math, AI does the synthesis. That principle cut recurring reporting turnaround from about two days to under four hours and standardized how experiment readouts and budget recommendations get made.

Experimentation Incrementality Attribution Targeting & Selection Lifecycle & LTV Vendor Management SQL Python BigQuery Tableau Claude AI
~$1M
Lost originations recovered through targeting & suppression
~3M
New acquisition prospects unlocked
+2M
Addressable customer reach expanded
2d→4h
Recurring reporting turnaround, via AI workflows
How I operate

Execution

End to end, not hand-offs

From targeting and audience selection through channel launch, performance tracking, and reporting — I've owned the full loop across email, onsite placements, direct mail, paid search and social, and sales channels, including the vendors and data partners that power each one.

Solutioning

Ambiguity to recommendation

I take an ambiguous business question, design the measurement to answer it, and land on a clear call — Fund / Hold / Suppress, Ship / Kill / Iterate — with the revenue case attached, not just the analysis.

Stakeholders

Built for the room

Cross-functional partnership with Marketing, Product, Commercial, Risk, and Finance, vendor and partner management, and executive reporting that leadership actually reads — performance framed as decisions, not dashboards.

Reporting & Optimization

Dashboards that drive the next move

Self-serve dashboards and reporting infrastructure in BigQuery, Python, and Tableau, plus channel pacing and forecasting across weekly, monthly, and quarterly horizons — built to catch underperformance early and reallocate budget while a campaign is still live, not after the fact.

Certifications

AI & Automation
Claude 101Anthropic
Claude Code 101: From Prompt to ProductAnthropic
Introduction to Claude CoworkAnthropic
AI Coder: Complete Claude Code & Coding AgentsUdemy
Data & Visualization
Tableau 10 Advanced Training: Master Tableau in Data ScienceUdemy
Tableau 10 A-Z: Hands-On Tableau Training for Data ScienceUdemy
Prepare Data for Looker Dashboards and ReportsGoogle

Work samples

Working AI tools built with Claude — each one solving a real problem from my day-to-day analytics work. Open them and use them live.

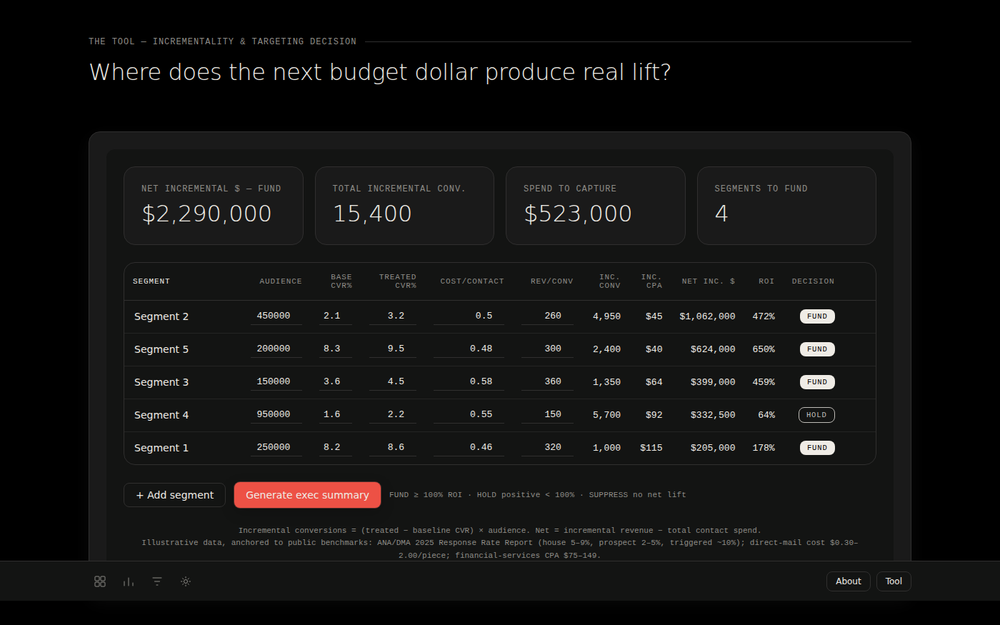
Screenshot of the Incrementality and Targeting Decision Tool: segment table with ROI and Fund/Hold decisions
Budget allocation

Incrementality & Targeting Decision Tool

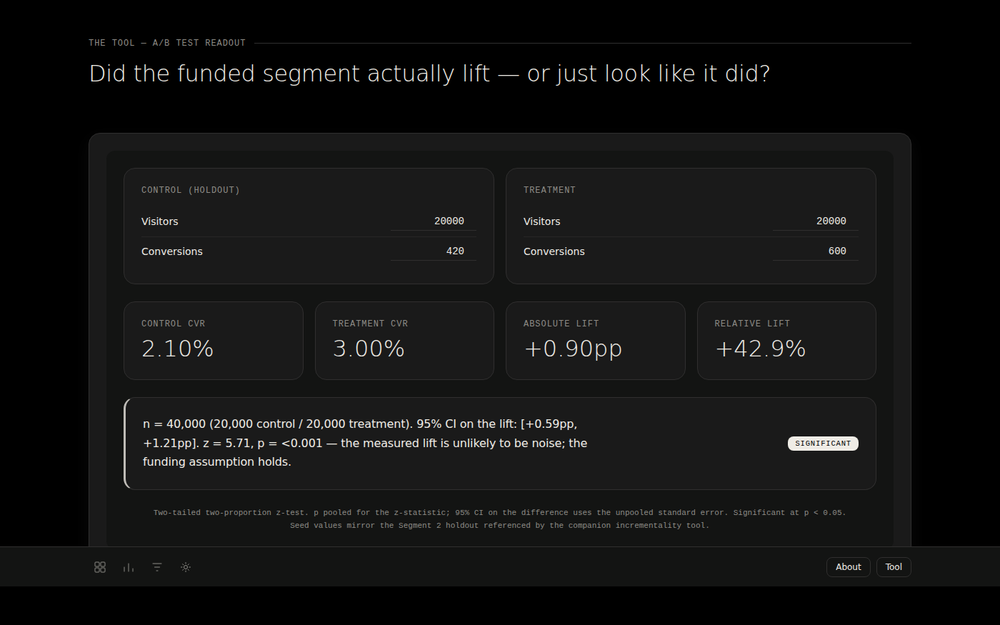
Fund what moved the needle — not what merely followed it. Scores segments on true incremental lift, tags each Fund / Hold / Suppress by ROI, and generates the executive budget recommendation, validated against a randomized holdout.

Open the live tool
Field note · Matched-market test

Can a billboard prove it moved the needle?

The problem

Offline channels can't be A/B tested at the user level — there's no impression to randomize and no holdout to carve. A billboard goes up in Chicago, applications rise, and everyone claims the win. But how much of that rise was the billboard?

The approach

Find Chicago a statistical twin — a city matched on income, customer mix, traffic, business density, and seasonality. Detroit qualifies. Chicago gets the billboards; Detroit doesn't. Then compare each city to itself, before and after: a difference-in-differences design.

The call

Chicago rose by 300 applications — but Detroit rose by 70 with no billboard at all. That 70 is the market tide. Only the gap between them is the billboard's real effect.

The naive readout would have credited the billboard with +300 — overstating its impact by 30%. The twin city is what makes the number honest.

The receipt

Chicago, before → after1,000 → 1,300
Chicago lift+300
Detroit (twin), before → after980 → 1,050
Detroit lift (market tide)+70
Incremental apps (300 − 70)230
Revenue @ $2,000 avg$460K
Campaign cost$260K
Net incremental+$200K
Verdict: Positive ROI — fund it

Illustrative numbers. The method — matched-market difference-in-differences — is the point.

Field note · Portfolio funnel diagnosis

Applications were falling — was that actually the problem?

The signal

New-application volume (PIF) had been trending down quarter over quarter. Total portfolio volume looked fine on the surface — which made it tempting to file the PIF decline as noise and move on.

The diagnosis

An end-to-end funnel review told a different story: portfolio growth wasn't coming from a healthy new-customer pipeline — renewals were doing the work. Meanwhile, federal Do-Not-Contact suppression volume was climbing quarter over quarter, shrinking the population the PIF funnel could even target in the first place.

The shift

I brought the split to cross-functional stakeholders and reframed the question — not "why are applications down," but "how do we solve the suppression constraint that's shrinking the funnel." That moved the roadmap from optimizing PIF campaigns to fixing the actual input constraint.

Renewals were masking a structural funnel problem. Without separating the two growth engines, the team would have kept tuning PIF campaigns and never touched the constraint actually shrinking them.

The split

Fed DNC suppression volume18K → 30K
Suppression growth+67%
New PIF applications (YoY)−12%
Renewal share of applications45% → 70%
Total portfolio volumePositive
Verdict: Fix the constraint, not the symptom

Illustrative numbers. PIF = new-customer application funnel; DNC = Do-Not-Contact suppression list.

Let's run the next experiment

Questions about the tools, a measurement problem worth talking through, or just want to connect? My inbox is open.

Prefer to reach out directly?